Now that you have had a chance to evaluate the clarity of several different graphics, let’s see how you do on your own. Create a circle graph or bar graph using the information in the data set below. Create your graph using Chartle or paper and pencil. Use what you have learned in the previous sections of this lesson about the graphic elements to make your graphic clear.
 When you are ready, return to the lesson and answer the questions below using your notes. When you’re finished, check your understanding to see some possible responses.
Source: Justin Bieber NRJ Music Awards 2012, Georges Biard, Wikipedia
Source: 82nd Academy Awards, Miley Cyrus - army mil-66456-2010-03-09-180301, Sgt. Michael Connors, Wikimedia
Source: 12 - Ed Sheeran, Ipswiich Borough Council, Wikipedia
Source: Swift performs in St. Louis, Missouri in 2013, Wikipedia
| Favorite Musical Artists of Neverland Middle School Students | |
|---|---|
| Artist | % Students |
| Justin Bieber | 20 |
| Ed Sheeran | 10 |
| Kristinia DeBarge | 15 |
| The Jonas Brothers | 20 |
| Robin Thicke | 5 |
| Miley Cyrus | 10 |
| Taylor Swift | 20 |
Sample Responses:
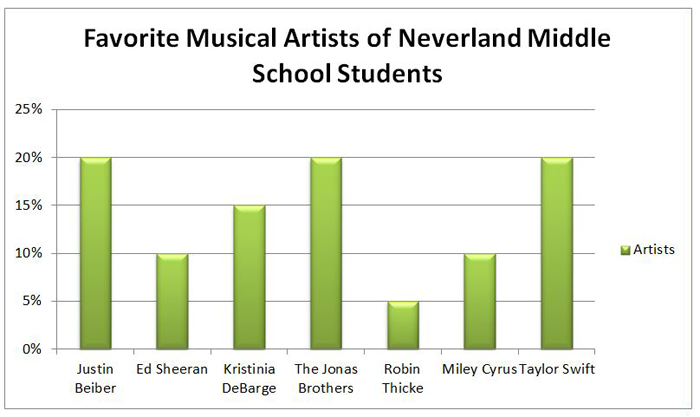
Source: neverland_bar_graph, IPSI
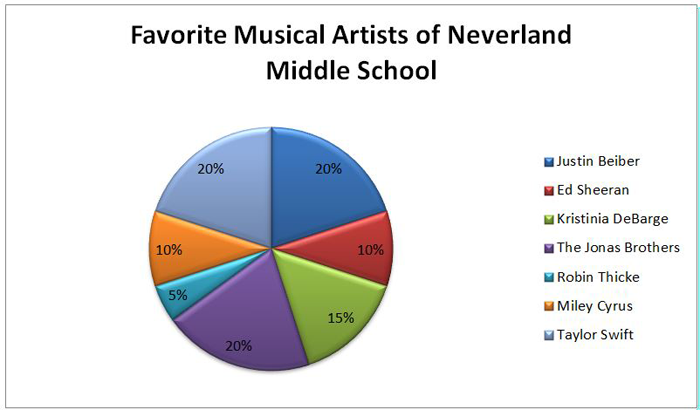
Source: neverland_circle_graph, IPSI