Graphic Organizers for Getting Ideas
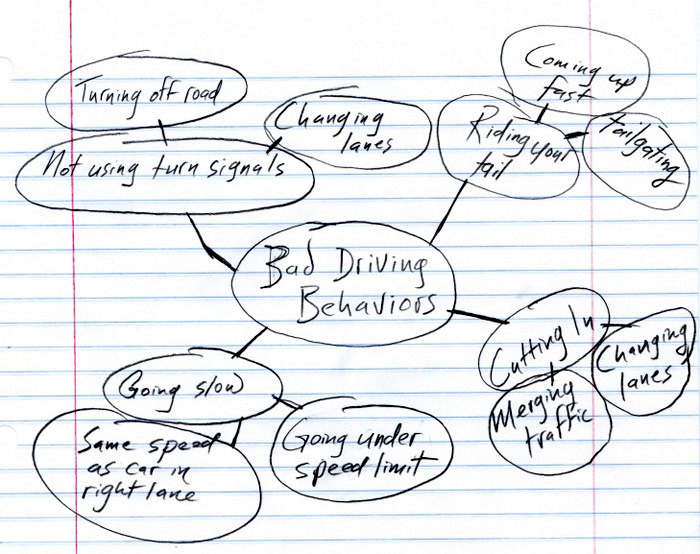
Most writers have a favorite way to start brainstorming ideas for a writing assignment: some like to freewrite, some like to make lists, and some like to go for a long walk. One of the most common ways to get ideas is to use clustering, mapping, or webbing. There are several names for this process, but they all refer to a system for attaching ideas to one another, as in the diagram below.
Source: IPSI

This process can go as far as you can push it. The beauty of it is that you can fit anything in; you just make a new subcategory. The subcategories do not have to be parallel. Plus, you can jumble examples in without worrying about whether they relate in the same way as other examples. It is an open system, which can be extraordinarily helpful.
You start with a blank page. You draw the circle in the middle with the topic in it, and then you draw the circles and the connecting lines as you think of ideas.
Just for some practice with clustering, click on the circles below to see a comparison.
From this point, you could add a subcategory labeled “Effects of Expressing Anger.” This could be subdivided into “Benefits” and “Drawbacks.” Or you could brainstorm more examples of the different ways to express anger. It might turn out that you have many and therefore decide to write about just that branch of the web. This sort of flexibility is the beauty of using the web. A web is better than a list because it indicates relationships and better than an outline because the relationships and the order of the items are easy to change.

If you did decide to write just about benefits and drawbacks or any other thesis that has a pros-and-cons structure, you might use a different sort of graphic organizer: the T chart.
This is the simplest graphic organizer: it heads two lists with the main topic and allows you to write ideas for and against the main topic.
You can adjust the organizer to suit your topic and purpose. Say you want to generate ideas for writing a paper that responds to the question, “Should drivers express their anger at bad driving by other drivers?” You might want to use a T chart that has “because” already written in to start each item. This will remind you to think of reasons for and against, not just ideas that are related.
For the next activity, drag and drop the reasons why bad driving should and shouldn't be ignored into the correct column of the chart. Again, you will be creating a list of reasons for and against confronting bad driving.

It is a good idea to make a T chart even if you already know whether you are for or against the issue you’re working with. Why? The T chart can help you see what counterarguments you will have to answer in order to write a convincing argument.
To refute opposing arguments in this way is a powerful rhetorical technique, and it is easy to do if you take time to fill out a T chart.