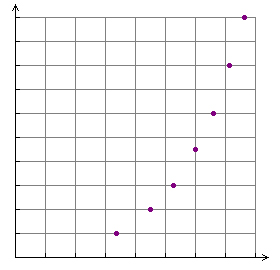

Hopefully you notice the points are not linear. When the curve is added you can see half of the “U” shape that quadratic equations produce.
The correlation coefficient of 0.999 is very good.

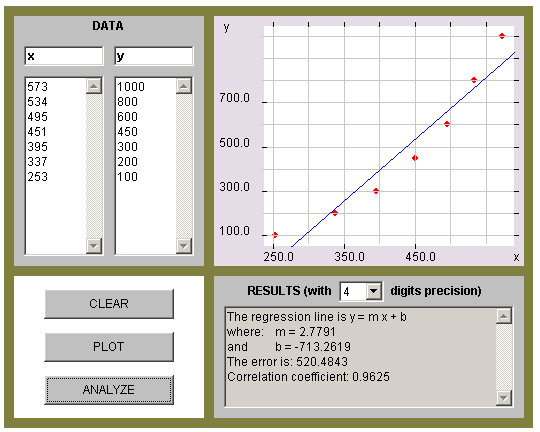
The screen above is from a linear regression of the data. The 0.9625 is a pretty good correlation coefficient but not as good as 0.999 from the quadratic regression.
In the assessment after this lesson you will be asked to identify the type of scatterplot given. Hopefully you recognize the curve of the data and that it is not linear.

Close this tab or window to return to the lesson.