
Why or how can we plot the reflected points? Let’s look at another example.
Graph y = 2 (x – 1)2 – 2.
y = a (x – h)2 + k
y = 2 (x - 1)2 – 2
By comparing the given equation to the vertex formula → h = 1 and k = - 2, the vertex point is located at (1, - 2).
Since x = (x-coordinate of the vertex) h is the axis of symmetry in this problem the axis of symmetry is x = 1.
Create a table so you can plot more points for an accurate sketch.
| x | Substitute Into Equation y = 2 (x – 1)2 – 2 |
y | |
| Vertex point | 1 | Above | - 2 |
| Next, pick two more x-values on either side of 1 (because parabolas are symmetric) Point to the left of the (x = 1) |
-1 | y = 2 (- 1 – 1)2 – 2 = 6 | 6 |
| Another point to the left of the (x = 1) | 0 | y = 2 (0 – 1)2 – 2 = 0 | 0 |
| Point to the right of the (x = 1) | 2 | y = 2 (2 – 1)2 – 2 = 0 | 0 |
| Another point to the right of the (x = 1) | 3 | y = 2 (3 – 1)2 – 2 = 6 | 6 |
|
You may be wondering why it was important to pick x-values on One side of the vertex. |
Good Question: You probably understand why the vertex is important. It is the “turnaround” point of the parabola where the graph changes direction. (i.e. from decreasing to increasing or vice-versa)
You do need to have the vertex AND points on both sides of it or you could be plotting points for a LONG time trying to find the REAL shape of the graph!
If you study the y-coordinates, you can see the symmetry of the parabola across x = 1, especially if you view the table horizontally.
x |
- 1 |
0 |
1 |
2 |
3 |
y |
6 |
0 |
- 2 |
0 |
6 |
Notice that if you move the same number of units to the left or right of the vertex the y-coordinates are the same or equal. For example, one x-unit to the left and to the right of (1,- 2) have the same y-coordinates, (0, 0) and (2, 0).
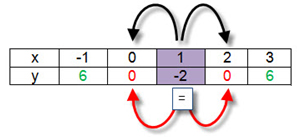 |
(0, 0) and (2, 0). |
If you move two x-units to the left or right of the vertex of (1, - 2), the y-coordinates are also equal.
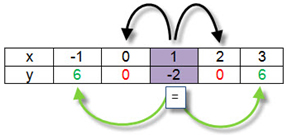 |
(-1, 6) and (3, 6). |
 |
Conclusion: If you know the vertex and any two other points on the graph, you can use symmetry to find their matching points on the other side of the axis of symmetry. |
Plot the three points and draw in the axis of symmetry, then plot the symmetric points and graph.
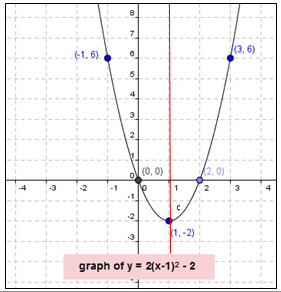
Instead of finding four points you can plot two points and reflect them across the axis of symmetry.
Step 4: Sketch your parabola.
Close this window or tab to return to the lesson.