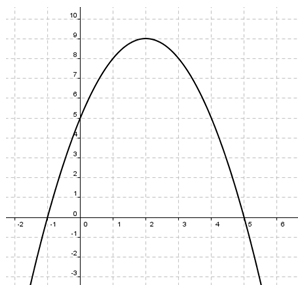
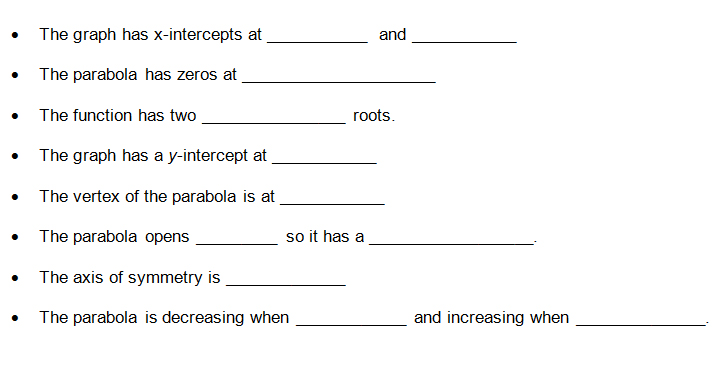
![]() Move your mouse over the blanks to reveal the answers.
Move your mouse over the blanks to reveal the answers.


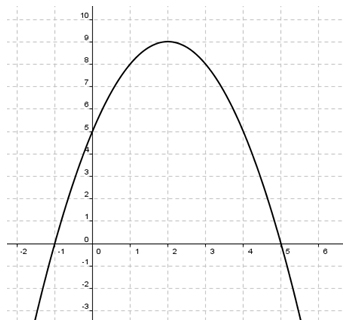
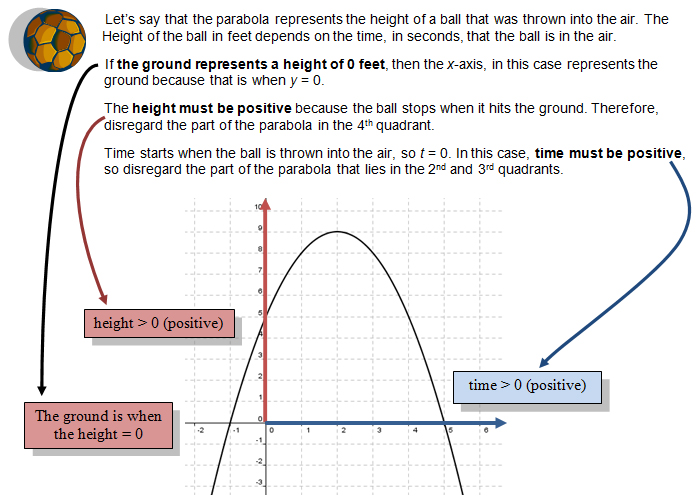
You can also provide a verbal description from a graph that represents a real world situation. Let’s use the same graph and think up a verbal description that could represent the graph.


After analyzing our situation, the graph that represents our problem is only part of the parabola and looks like the red graph shown below.

What observations can be made from our red graph above? Move your mouse over the blank to reveal the answer.

Close this window or tab and return to the lesson.