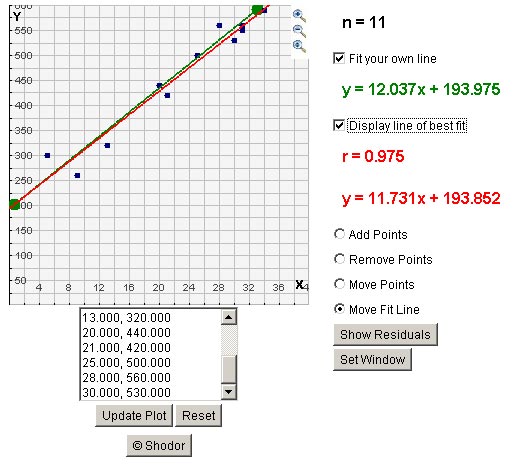
n = 11 tells you how many data points are being used.
r = 0.975 tells you how good of a fit the line is. You may also see this written as r2. The closer you are to 1 (positive correlation) or –1 (negative correlation), the better the line is to the data.
Close this tab or window to return to the lesson.