
Which situation described below would best be modeled using a quadratic equation?
A
Incorrect. This would be represented by a cubic function.
B
Incorrect. This situation would best be modeled by a linear function since there is a constant rate of increase in price for each topping added.
C
Correct! Area is almost always modeled by a quadratic function. In this situation, the area of the rectangle, A= lw, would be given in units squared.
D
Incorrect. Since half of the teams are eliminated after each round, the function would decrease by ½ each time making an exponential (decay) model best for this situation.
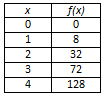
Which table of values displayed below would best be modeled using a quadratic equation?
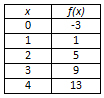
A
Correct! Second differences are constant so a quadratic function would be an appropriate model.
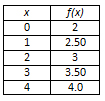
B
Incorrect. In this table, the first differences are constant so a quadratic function would not be appropriate. A linear function would best model this data.
C
Incorrect. In this table, the first differences are constant so a quadratic function would not be appropriate. A linear function would best model this data.
D
Incorrect. In this table, the second differences are not constant so a quadratic function would not be appropriate. An exponential function would best model this data.
Which situation described below would best be modeled using a quadratic equation?
A. A birthday candle is burning at a steady rate. The height of the candle is a function of the time elapsed since the candle was lit.
Incorrect. Since the candle is burning at a constant rate, the function is linear and decreasing.
B. A professional baseball player makes contact with the ball when it is 3 feet above the ground. The ball is hit at a speed of 120 feet per second. The height of the ball, in feet, is a function of time.
Correct! The height of the ball, or any object that rises or falls under the influence of gravity, is modeled by a quadratic function where the leading coefficient is based on acceleration due to gravity and the height of the object depends upon time.
C. A CD club offers its members a wide variety of CDs that cost $8.00 each. The amount spent depends upon the number of CDs purchased.
Incorrect. The amount spent increases at a constant rate for each CD; therefore, the function is linear and increasing.
D. You inherit $2000 from your aunt and decide to invest it in a savings account that has an 8% interest rate that is compounded annually. The amount of money in your account is a function of the time your money remains in the account.
Incorrect. This situation is best modeled by an exponential function since, each year, the interest is figured on the increasing amount in the account.
The actual stopping distance of a moving vehicle depends upon many factors, including the speed of the car, the driver's reaction time, weather conditions, road conditions, and the quality of the brakes. The data in the table below gives various speeds of a car, in mph, and the corresponding driver's reaction distance, the braking distance, in meters, and the total stopping distance of the vehicle.
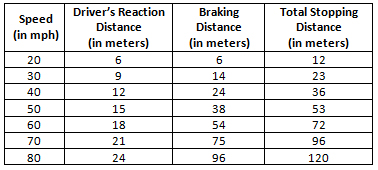
Which scatterplot and corresponding model below best represent the total stopping distance as a function of the vehicle's speed?
| A. y = .015x2 + .331x − .5 | 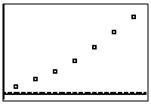 |
| B. y = .3x | 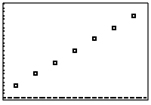 |
| C. y = .3x | 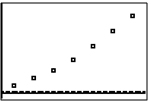 |
| D. y = .015x2 + .331x − .5 | 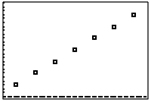 |
A
Correct! This scatterplot and quadratic model represent the total stopping distance vs. the vehicle’s speed.
B
Incorrect. This scatterplot and linear model represent the driver’s reaction distance vs. the vehicle’s speed.
C
Incorrect. The scatterplot represents the total stopping distance vs. the vehicle’s speed, but the linear model does not fit the data.
D
Incorrect. The scatterplot does not represent the total stopping distance vs. the vehicle’s speed, and the model does not match the data.