Question 1
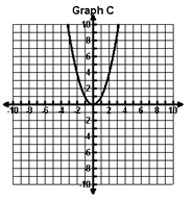
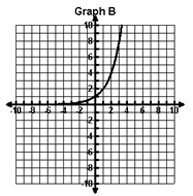
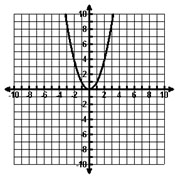
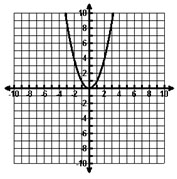
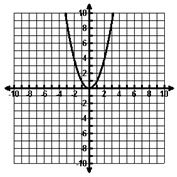
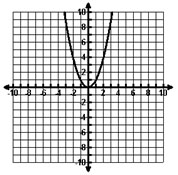
Which of the following is the graph of the quadratic parent function?
| A. |
C. |
| B. |
D. |
Question 2
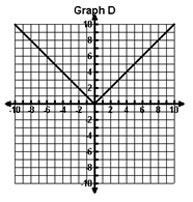
Which of the following is the graph of the absolute value parent function?
A. 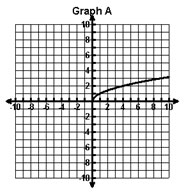 |
C. 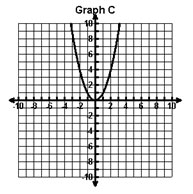 |
B.  |
D. 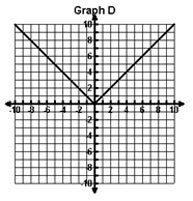 |
Question 3
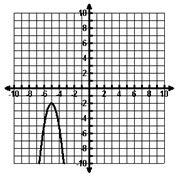
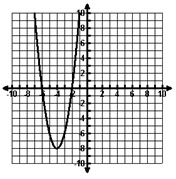
The graph of the function f(x) = x2 is shown below.
Which of the following would describe the graph of f(x) = -x2 ?
Question 4
The graph of y = x2 is shown below.
Which of the following would describe the graph of y = (x − 3)2 + 4?
Question 5
The graph of y = x2 is shown below.
Which of the following is NOT true about the graph of y = -2(x + 1)2?
Question 6
The graph of y = x2 is shown below.
Which of the following is a true statement about the graph of y = 1 4 (x − 5)2 − 7?
Question 7
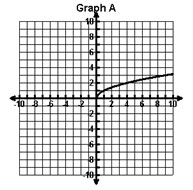
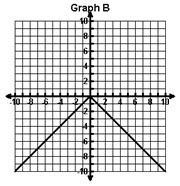
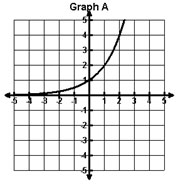
The graph of y = 3|x| is shown on Graph A.
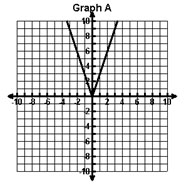
Which of the following functions is shown on Graph B?
Question 8
Look at the two functions shown below.
| Function A f(x) = |x − 4| + 8 |
Function B f(x) = 2|x − 2| + 4 |
Which of the following is a true statement about the functions?
Question 9
The picture below shows the intersection of a plane and a double-napped cone.
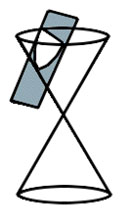
Which of the following describes the intersection?
Question 10
The picture below shows the intersection of a plane and a double-napped cone.
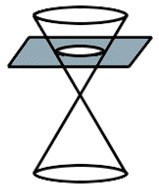
Which of the following describes the intersection?
Question 11
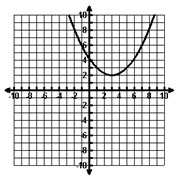
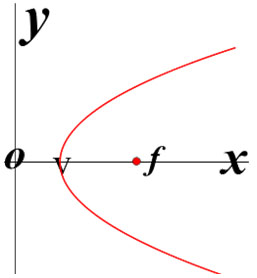
Which of the following equations correct describes the parabola shown on the graph below?
Question 12
Which of the following equations is represented by the graph below?
Question 13
Which of the following statements is true about the graph of the equation below?
(x − 2)2 + (y + 3)2 = 4
Question 14
Look at the two equations below.
| Equation A (x + 1)2 + (y + 5)2 = 25 |
Equation B (x + 1)2 + (y + 5)2 = 36 |
How does the graph change from Equation A to Equation B?
Question 15
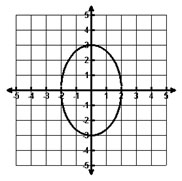
The graph of  = 1 is shown below.

How will the graph change is the equation is changed to  = 1?
= 1?
Question 16
The graph of  = 1 is shown below.

How will the graph change if the equation is changed to  = 1?
= 1?
Question 17
The graph of  = 1 is shown below.
How will the graph change if the equation is changed to  = 1?
= 1?
Question 18
The graph of  = 1 is shown below.
How will the graph change if the equation is changed to 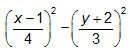 = 1?
= 1?
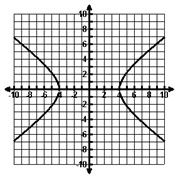
Question 19
The graph of  = 1 is shown below.

How will the graph change if the equation is changed to  = 1?
= 1?
Question 20
Look at the equations of hyperbolas below.
Equation A 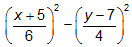 = 1 = 1 |
Equation B  = 1 = 1 |
Which of the following is a true statement about the graphs of the two equations?
Question 21
All planets orbit the Sun in elliptical orbits with the Sun as one common focus.
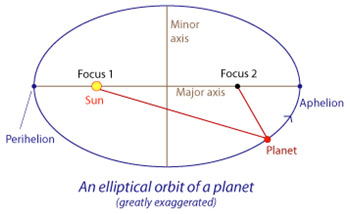
Which of the following is a true statement about the diagram of the elliptical orbit of a planet?
Question 22
The graph of a parabola is shown below.
Which of the following is NOT a true statement about the graph?
Question 23
Look at the equations below. The graph of each equation represents a conic section.
Equation A
4x2 + 9y2 − 16x + 90y + 205 = 0
Equation B
2y2 + x − 12y + 10 = 0
Equation C
9x2 − 4y2 + 90x + 32y + 197 = 0
Which of the equations represents a parabola?
Question 24
Look at the equations below. The graph of each equation represents a conic section.
Equation A
25x2 + 9y2 − 200x + 18y + 184 = 0
Equation B
x = y2 − 4y + 3
Equation C
x2 − y2 + 4x + 16y − 69 = 0
Which of the equations represents a circle?
Question 25
Look at the equations below. The graph of each equation represents a conic section.
Equation A
36x2 + 9y2 − 216x = 0
Equation B
y = 3x2 + 17
Equation C
3x2 − 4y2 = 17
Which of the equations represents a ellipse?
Question 26
Joe's garden is twice as long as it is wide. If Joe increases the width by 3 feet on each end and the length by 2 feet on each end, the area of the enlarged space can be expressed by the equation y = (x + 6)(2x + 4) or y = 2(x + 4)2 − 8. The graph of this function is shown below.
If Joe decides to only increase the width by 1.5 feet on each side and only increase the length by 1 foot on each side, how will the graph change?
Question 27
The graph of y = √x is shown below.
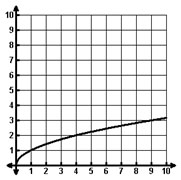
Which of the following shows a vertical stretch of the function?
A. 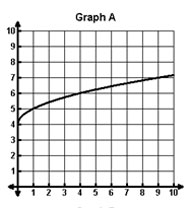 |
C. 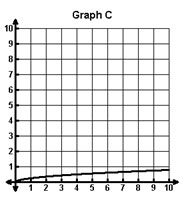 |
B. 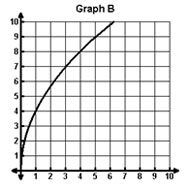 |
D. 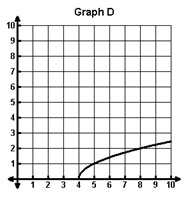 |
Question 28
Graph A is the graph of y = a(b)x.
Graph B is the graph of y = a(b)x-h + k.
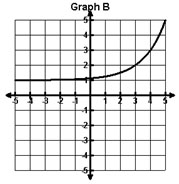
Which of the following functions is shown in Graph B?