The following graph represents the path of a bouncing ball. Describe the translation that occurred between the first and second bounce.
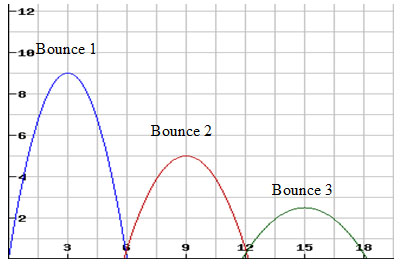
A. It translated 6 units to the right and 4 units down.
Correct! The second bounce shifted 6 units right (9 – 3) and 4 units down (9 – 5).
B. It translated 3 units to the right and 4 units down.
Incorrect. You are correct in that it shifted 4 units down but you need to look at the x values again.
C. It translated 4 units to the right and 6 units down.
Incorrect. You reversed the x and y values.
D. It translated 6 units to the right and 4 units up.
Incorrect. You are correct that that it shifted 6 units to the right but it did not shift up.
Two balls drop from a 10 story apartment building. The first ball dropped from the roof which is 132 feet from the ground. The second ball dropped from the 7th story which is 85 feet from the ground. Using the height function h(t) = -16x2 + c, determine the translation of the graph of the first ball that dropped to graph of the second ball that dropped.
A. It translated 85 feet down.
Incorrect. Look at the different from the height at 132 ft to 85 ft above the ground.
B. It translated 47 units to the left.
Incorrect. This is not a horizontal shift. The starting height represents the “k” constant.
C. It translated 47 units down.
Correct! This is the vertical shift.
D. It vertically stretch by a factor of 47.
Incorrect. This is not a stretching or compression translation. The change is in the height, “k”.
Two softballs are dropped on different planets from a height of 45 feet. The height function in terms of meters for an object dropped on Mercury is hM(t) = -1.85x2 + 45. The height function in terms of meters for an object dropped on Neptune is hN(t) = -5.575x2 + 45. Which softball will hit the ground the first?
A. The softball on Mercury.
Incorrect. Look at the “a” value again.
B. The softball on Neptune.
Correct! The softball on Neptune will hit the ground before the softball on Mercury.
C. They both would hit the ground at the same time.
Incorrect. Look at the “a” values again.
D. Cannot determine from the information provided.
Incorrect. There is enough information provided. Look at the value before the x squared.
A quadratic function can be used to model the path of a football kicked during an extra point. The graph below represents the paths of two separate extra points. The x-axis represents the distance, in yards, the ball has traveled. The y-axis represents the height, in yards, of the football.
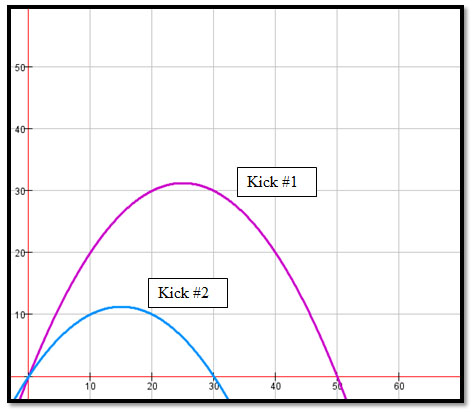
What information can you gather from this graph?
A. Kick #1 went 50 yards farther than Kick #2.
Incorrect. Look again at how far both kick #1 and #2 went.
B. Kick #1 went 20 yards higher and 50 yards longer than kick #2.
Incorrect. You are correct in that it was 20 feet higher but check the distance each kick went.
C. Kick #1 when 31.25 yards higher than kick #2.
Incorrect. Look again at the height for both kick #1 and #2.
D. Kick #1 went 20 yards higher and 20 yards farther than kick #2.
Correct! Distance traveled: 50yds – 30yds = 20yds Height: 31.25yds – 11.25yds = 20yds