A. Exponential
Incorrect. You’d see more vertical points.
B. Logarithmic
Incorrect. Logarithmic scatterplots are s-shaped.
C. Linear
Incorrect. Not the shape of the line.
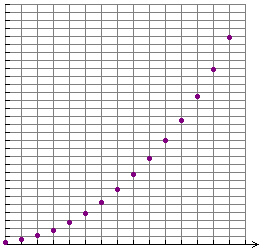
D. Quadratic
Correct! You can see the right half of a U.
A. Exponential
Incorrect. No curve to the points.
B. Logarithmic
Incorrect. Logarithmic scatterplots are s-shaped.
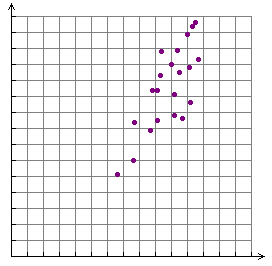
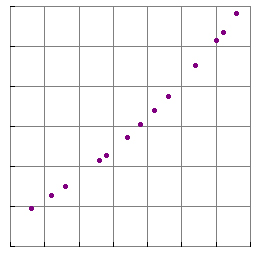
C. Linear
Correct! Points are going up similar to a line.
D. Quadratic
Incorrect. No curve to the points.
A. Exponential
Incorrect. The points would continue to rise.
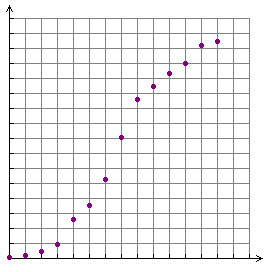
B. Logarithmic
Correct! Logarithmic scatterplots are S-shaped.
C. Linear
Incorrect. Not the shape of the line.
D. Quadratic
Incorrect. This is not U-shaped.
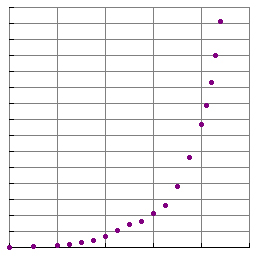
A. Exponential
Correct! The vertical lines give it away.
B. Logarithmic
Incorrect. Logarithmic scatterplots are S-shaped.
C. Linear
Incorrect. Not the shape of a line.
D. Quadratic
Incorrect. The vertical points tells you it’s something else.
A. Exponential
Incorrect. The data is not growing fast enough.
B. Logarithmic
Incorrect. Logarithmic scatterplots are S-shaped.
C. Linear
Incorrect. There is a slight curve to the data.
D. Quadratic
Correct! There is a slight curve to the data points.