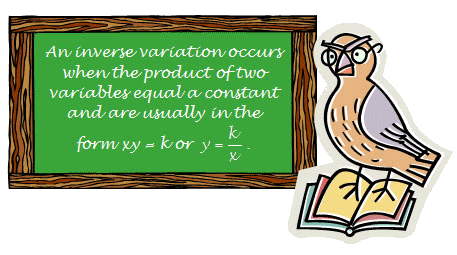
In this section, tables are analyzed to determine if they represent an inverse variation.

The table below represents a relationship that is an inverse variation. Multiply the values for x and y together in each column. Use the link beneath the table to check your answer.
| x | 2 | 3 | 4 |
|---|---|---|---|
| y | 6 | 4 | 3 |
 |
 |
 |
|
| Process | 2 × 6 = ___ | 3 × 4 = ___ | 4 × 3 = ___ |
Interactive popup. Assistance may be required.
2×6=12
Interactive popup. Assistance may be required.
The products are the same, and they are 12 each time.
The table below represents a relationship that is NOT an inverse variation. Multiply the values for x and y together in each column. Use the link beneath the table to check your answer.
| x | 2 | 3 | 4 |
|---|---|---|---|
| y | 4 | 6 | 8 |
 |
 |
 |
|
| Process | 2 × 4 = ___ | 3 × 6 = ___ | 4 × 8 = ___ |

Interactive popup. Assistance may be required.
The products are different.
If a relationship between x and y is an inverse variation, what can you say about the product of each pair of numbers xy?
Interactive popup. Assistance may be required.
If a relationship is an inverse variation, the product xy will be the same for each pair of numbers x and y.
A constant product for an inverse variation is also called the constant of proportionality, k. How are k and the product xy related?
Interactive popup. Assistance may be required.
xy = k.