What are the x-intercepts of the graph of the equation y = x2 + x − 20?
A. x = 5, x = 4
Incorrect. Graph the equation using your graphing calculator. Find the x-intercepts on the graph or by looking for y = 0 in the table.
B. x = 5, x = -4
Incorrect. Graph the equation using your graphing calculator. Find the x-intercepts on the graph or by looking for y = 0 in the table.
C. x = -5, x = -4
Incorrect. Graph the equation using your graphing calculator. Find the x-intercepts on the graph or by looking for y = 0 in the table.
D. x = -5, x = 4
Correct! The parabola cross the x-axis at -5 and 4.
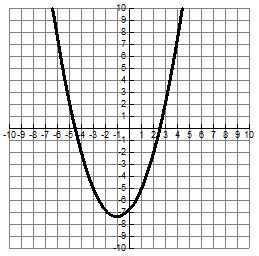
Which points best represent the roots of the graphed quadratic equation shown below?

A.
Incorrect. Look at the negative root again. Make sure you have read the graph correctly.
B.
Correct! The parabola crosses the x-axis between -4 and -5, or approximately -4½, and between 2 and 3 or approximately 2½.
C.
Incorrect. The roots of a quadratic function are the x-intercepts. The y value of the x-intercept is always zero (0).
D.
Incorrect. The roots of a quadratic function are the x-intercepts. The y value of the x-intercept is always zero (0).
Which ordered pair represents one of the zeros of the function f(x) = 6x2 + 11x − 35?
A.
Incorrect. The zeros of a quadratic function are the x-intercepts.
B.
Incorrect. The zeros of a quadratic function are the x-intercepts.
C.
Correct! The parabola crosses the x-axis at -3.5.
D.
Incorrect. The zeros of a quadratic function are the x-intercepts.
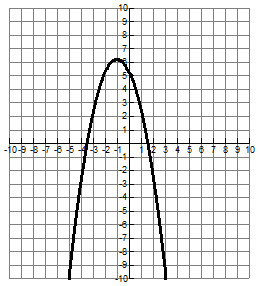
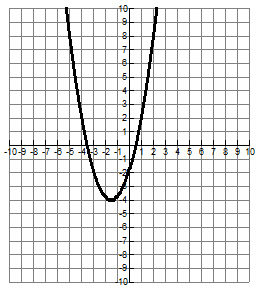
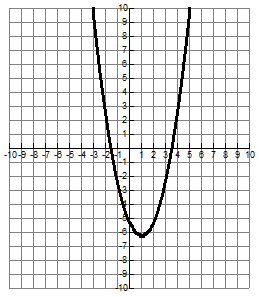
Which graph best represents an equation that has the roots x = - 7 2 and x = 3 2 ?


A.
Correct! The parabola crosses the x-axis at -3.5 and 1.5.
B.
Incorrect. Remember that roots can be found where the graph crosses the x-axis. It may be helpful to change the fractions to their equivalent decimal representations.
C.
Incorrect. Remember that roots can be found where the graph crosses the x-axis. Check the signs on the roots and examine the graph again. It may be helpful to change the fractions to their equivalent decimal representations.
D.
Incorrect. Remember that roots can be found where the graph crosses the x-axis. One of the roots is negative. Check the graph again. It may be helpful to change the fractions to their equivalent decimal representations.