Match the graph of the quadratic function to its correct verbal description.

A. Positive a value, minimum, one solution or zero.
Correct! The graph of the quadratic function opens up therefore the “a” value is positive, it has a minimum and one zero, the point where it intersects with the x-axis.
B. Positive a value, minimum, no solutions or zeros.
Incorrect. Since the graph opens up the “a” value is positive and there is a minimum but the graph intersects the x-axis at one point creating a solution or zero.
C. Negative a value, maximum, two solutions or zeros.
Incorrect. Since the graph opens up the “a” value is positive.
D. Positive a value, minimum, two solutions or zeros.
Incorrect. Since the graph opens up the “a” value is positive and there is a minimum but the graph intersects the x-axis at one point creating a solution or zero.
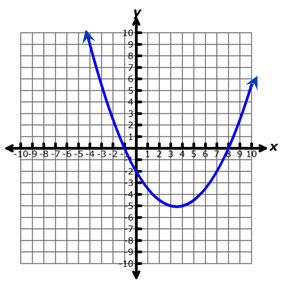
The graph of a quadratic function is shown below.

Which statement about this graph is not true?
A. The graph has a y-intercept at (0, -2).
Incorrect. The graph crosses the y-axis at (0, -2), so this point is the y-intercept.
B. The graph has a minimum point at (3.5, -5).
Correct! The vertex of the graph is at the point (3.5, -5), and since the graph points upward, the vertex is a minimum point.
C. The graph has an x-intercept at (8, 0).
Incorrect. The graph crosses the x-axis at (8, 0), so this point is the x-intercept.
D. The graph has a line of symmetry at the y-axis.
Incorrect. The line x = 3.5 does mark the line of symmetry for this parabola.
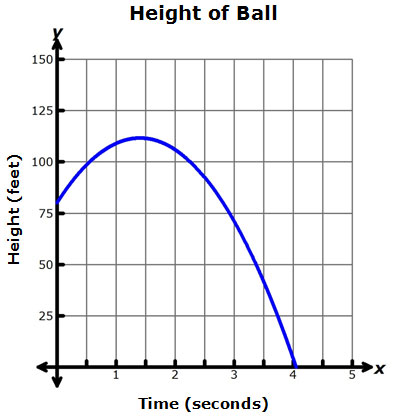
The graph below shows the height of a ball from the time it is thrown from the top of a building until the time it hits the ground.

How much time elapses while the ball is 100 feet or more above the ground?
A. Less than 1 second
Incorrect. The elapsed time is the amount of time between when the ball first reached a height of 100 feet and the time when the ball reached 100 feet again on its way to the ground.
B. Between 1 and 2 seconds
Correct!
C. Between 2 and 3 seconds
Incorrect. The elapsed time is the amount of time between when the ball first reached a height of 100 feet and the time when the ball reached 100 feet again on its way to the ground.
D. More than 3 seconds
Incorrect. Each grid line in the x-direction represents 0.5 seconds.
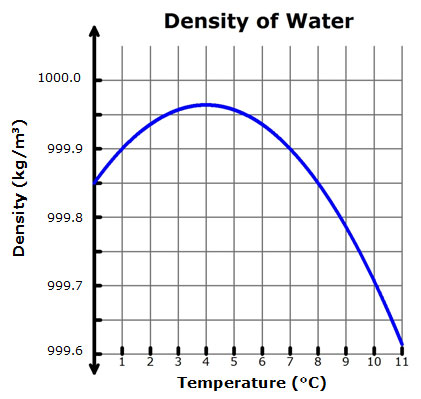
The graph below represents the relationship between the density of water and the temperature of the water.

According to the graph, at which temperatures is the density of water 999.85 kilograms per cubic meter?
A. 0°C and 8°C
Correct!
B. 1°C and 7°C
Incorrect. For these temperatures, the density of water is 999.9 kilograms per cubic meter.
C. 4°C only
Incorrect. This temperature is when the density of water is a maximum value.
D. 8°C and 11°C
Incorrect. Locate the temperatures that intersect the graph with a horizontal line drawn through 999.85 kilograms per cubic meter.
The graph below represents the relationship between the height of a ball and the distance it traveled after the ball was thrown.

What conclusion can be drawn from the graph about this relationship?
A. The ball reached a maximum height of about 16 feet after traveling a horizontal distance of approximately 45 yards.
Incorrect. The maximum height of the ball is represented by the vertex of the graph.
B. The ball reached a maximum height of about 16 feet after traveling a horizontal distance of approximately 20 yards.
Correct!
C. The ball was thrown from a height of approximately 6 feet before traveling a horizontal distance of about 48 yards.
Incorrect. The y-intercept, (0, 6), represents the height from which the ball was thrown, but the x-intercept, the horizontal distance before the ball reaches the ground, is not (48, 0).
D. The ball was thrown from a height of approximately 7 feet before traveling a horizontal distance of about 45 yards.
Incorrect. The y-intercept, (0, 6), represents the height from which the ball was thrown, which is 6 feet instead of 7 feet.