This data table shows that each day half of the pumpkins on the vine were harvested at Miller’s Farm. What type of relationship does this table demonstrate?
|
Days after Harvest Began |
Pumpkins on Vine |
|
1 |
32 |
|
2 |
16 |
|
3 |
8 |
|
4 |
4 |
|
5 |
2 |
A. Linear
Incorrect. A linear relationship would have a common difference between the numbers of pumpkins each day.
B. Quadratic
Incorrect. A quadratic relationship would have a second common difference between the numbers of pumpkins each day.
C. Exponential Decay
Correct! The number of pumpkins on the vine is decreasing by half each day.
D. Exponential Growth
Incorrect. The number of pumpkins on the vine is not increasing.
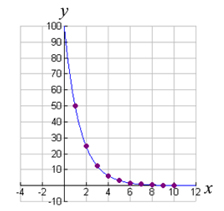
Look at the following graph. Which of the following situations could be modeled with this graph?

A. A biologist noticed that the population of ladybugs in an area doubled every 3 days.
Incorrect. The population is increasing, not decreasing.
B. When a ball is dropped from a height of 100 inches, the rebound height of each bounce decreases.
Correct! The height is decreasing each rebound.
C. Mr. Collins invested some money that will double in value every 17 years.
Incorrect. The money will increase in value.
D. The bacteria in a test tube were increasing each hour.
Incorrect. The bacteria were increasing, not decreasing.
|
Years |
Money in Account |
|
1 |
$2000 |
|
2 |
$2080 |
|
3 |
$2163.20 |
|
4 |
$2249.73 |
|
5 |
$2339.72 |
A. Linear
Incorrect. A linear relationship would have a common difference between the money in the account each year.
B. Quadratic
Incorrect. A quadratic relationship would have a second common difference between the money in the account each year.
C. Exponential Decay
Incorrect. An exponential decay relationship would have the money decreasing.
D. Exponential Growth
Correct! The amount of money in the account is increasing with compound interest.

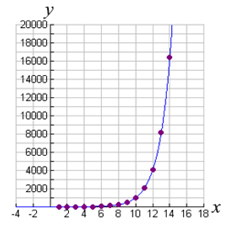
A. The mold counts in a sample are increasing every hour.
Correct! The amount of mold is increasing.
B. An air quality specialist recording the pollution in the air noticed that the pollution in one area was falling over time.
Incorrect. The y values on the graph are increasing over time.
C. A radioactive isotope carbon-11 decays, losing half its mass every 20 minutes.
Incorrect. The radioactivity is decreasing.
D. The natural fish in a lake are dying off because of the lack of oxygen.
Incorrect. The fish are decreasing in the lake.