A. 
B. 
C. 
D. 
A.
Incorrect. This is a model of direct variation.
B.
Incorrect. This is a quadratic model.
C.
Incorrect. This is a model of direct variation.
D.
Correct! The graph would be positioned in the first quadrant.
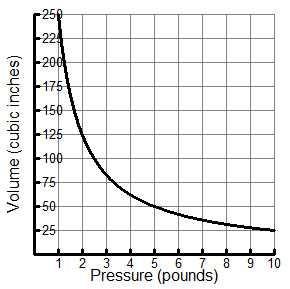
The volume of a gas varies inversely with the pressure. A graph of the relationship is shown below. What is the pressure of the gas when the volume is 125 cubic inches?

A. 50 pounds
Incorrect. Find x when the value of y = 125.
B. 2 pounds
Correct! x = 2 when y = 125.
C. 5 pounds
Incorrect. Find x when the value of y = 125.
D. 8 pounds
Incorrect. Find x when the value of y = 125.

A. 5 B. 1 5 C. 1 D. 2
A.
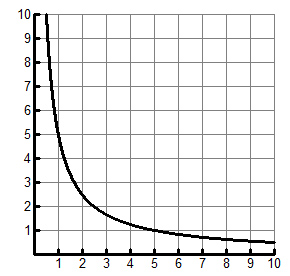
Correct! xy = k for all ordered pairs.
B.
Incorrect. Remember, xy = k for all ordered pairs.
C.
Incorrect. Remember, xy = k for all ordered pairs.
D.
Incorrect. Remember, xy = k for all ordered pairs.

A. $50
Incorrect. Find the value of y when x = 20.
B. $25
Incorrect. Find the value of y when x = 20.
C. $60
Incorrect. Find the value of y when x = 20.
D. $35
Correct! When x = 20, y = 35.