Lindsay and her friends are baking cupcakes for a bake sale. The graph below shows the total number of cupcakes they have compared to the number of hours they bake.
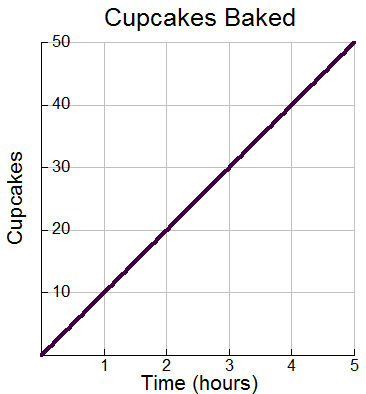
How would the graph change if Lindsay and her friends were given 20 cupcakes by the local bakery before they started baking?
A. The steepness would increase.
Incorrect. The friends are still baking cupcakes at the same rate each hour.
B. The y-intercept would increase.
Correct! The y-intercept would change from 0 to 20.
C. The y-intercept would decrease.
Incorrect. The number of cupcakes the friends started with would increase.
D. The steepness would decrease.
Incorrect. The friends are still baking cupcakes at the same rate each hour.
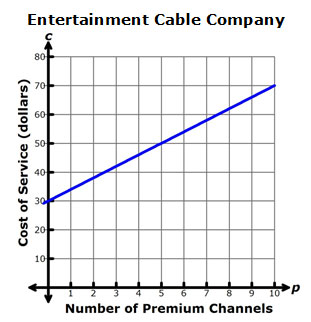
Entertainment Cable Company charges a monthly access fee plus an additional fee for each premium channel to which a customer subscribes. The graph below represents the current relationship.

The company has proposed to increase its monthly access fee by $5. Which equation shows the new monthly cost, c, where p is the number of premium channels to which a customer subscribes?
A. c = 35 + 4p
Correct!
B. c = 30 + 4p
Incorrect. This equation represents the current charges, not the proposed increase.
C. c = 30 + 9p
Incorrect. This equation increases the slope by a rate of $5 per premium channel, which would be an increase in the rate, not the monthly access fee.
D. c = 35 + 9p
Incorrect.
This equation shows both an increase in the y-intercept,
which is the monthly access fee, and the slope, which is the amount charged for
each premium channel.
As of March 1, the city of Pine Island had received an accumulated rain total of 12 inches, and the city of Cactus Branch had received an accumulated rain total that was 2 inches less than Pine Island. Each week, both cities received an additional 2 inches of rainfall. The graph below shows the accumulated rain total for the year for Pine Island.
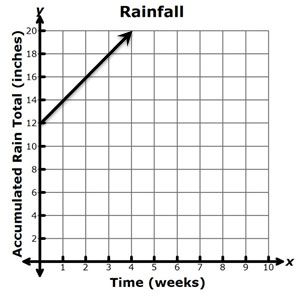
Which of the following graphs best shows the accumulated rain total for the year for Cactus Branch?
A.
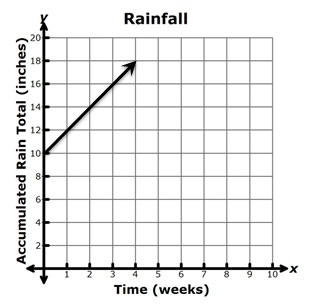
Correct!
B.
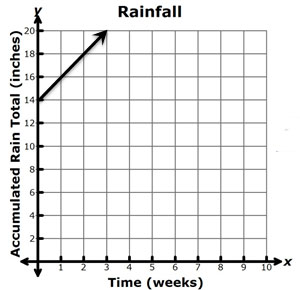
Incorrect. This graph shows the accumulated rain total for a city that began with 2 more inches of rainfall than Pine Island.
C.
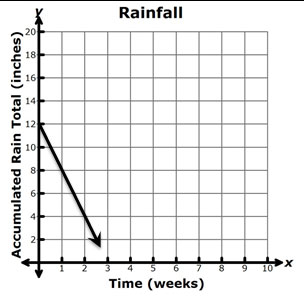
Incorrect. This graph shows a decrease of accumulated rain total of 2 inches per week.
D.
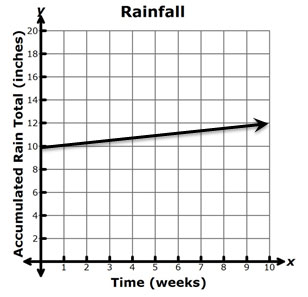
Incorrect. This graph shows a starting point of accumulated rain total that is 2 inches fewer than Pine Island, but only shows an increase in accumulated rain total of 2 inches over a 10-week period, which is 0.2 inches of rainfall per week.
An electrician uses the following chart to determine the total charge for a service call, including a fixed service fee and an hourly rate for the repair.
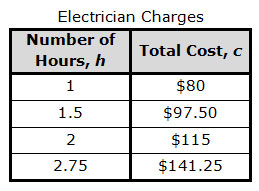
If the electrician increases her fixed service fee by $10, which equation can she use to build a new chart to determine how much to charge, c, for a service call that takes h hours?
A. c = 25 + 35h
Incorrect. This equation represents a decrease of $20 in the fixed service fee.
B. c = 35 + 35h
Incorrect. This equation represents a decrease of $10 in the fixed service fee.
C. c = 45 + 35h
Incorrect. This equation describes the relationship between the number of hours, h, and the total cost, c, contained in the table.
D. c = 55 + 35h
Correct!
The equation y = −ax + k represents the temperature, y, in Wichita Falls, Texas, x hours after a cold front passes through. If the temperature in Fort Worth, Texas, before the cold front passes through is 10 degrees warmer, which equation could be used to determine the temperature, y, in Fort Worth x hours after the cold front passes through?
A. y = -(a + 10)x + k
Incorrect. In this equation, the rate of change of the temperature is increased by 10 degrees.
B. y = -ax + (k + 10)
Correct!
C. y = -(a − 10)x + k
Incorrect. In this equation, the rate of change of the temperature is decreased by 10 degrees.
D. y = -ax + (k − 10)
Incorrect. In this equation, the temperature before the cold front passes through is cooler, or decreased by 10 degrees.