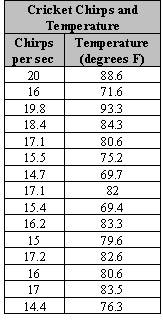
Which is the best equation for the line of best fit for the following data?

A. y = 3.3x + 25
Correct!
B. y = 3.2x + 18.5
Incorrect. The slope is too low.
C. y = 3.4x + 28
Incorrect. The slope is too high.
D. y = 5x
Incorrect. This line does not follow the same path as the data.
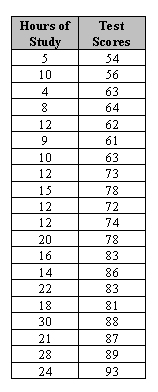
Which is the best equation for the line of best fit for the following data?

A. y = 4.5x
Incorrect. This line does not follow the same path as the data.
B. y = 1.5x + 43
Incorrect. The y-intercept it too low.
C. y = 1.5x + 57
Incorrect. The y intercept is too high.
D. y = 1.4x + 53
Correct!
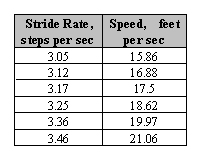
Which is the best equation for the line of best fit for the following data?

A. y = 30x − 75
Incorrect. This line does not follow the same path as the data.
B. y = 12.4x − 22
Correct!
C. y = 12x − 16
Incorrect. The y-intercept is too high.
D. y = 3.5x + 7.3
Incorrect. The slope is too low.
The equation for the line of best fit for data comparing test scores (y-value) and grade given in the student's math class (x-value) is given by y = 11.4x + 1346. Using this equation what would be the best prediction for the test score of a student that received an 80 in math class?
A. 2226
Incorrect. What value did you get when you used the table?
B. 2100
Incorrect. What did you try substituting into the equation?
C. 2258
Correct!
D. 2400
Incorrect. Did you check the table?
The equation for the line of best fit for data comparing test scores (y-value) and grade given in the student's math class (x-value) is given by y = 11.4x +1346. Using this equation what would be the best prediction for the grade needed in math class to receive a 2400 on the test?
A. 70
Incorrect. What value did you get when you used the table?
B. 90
Incorrect. Did you try substituting 2400 into the equation?
C. 92
Correct!
D. 105
Incorrect. Did you check the table?