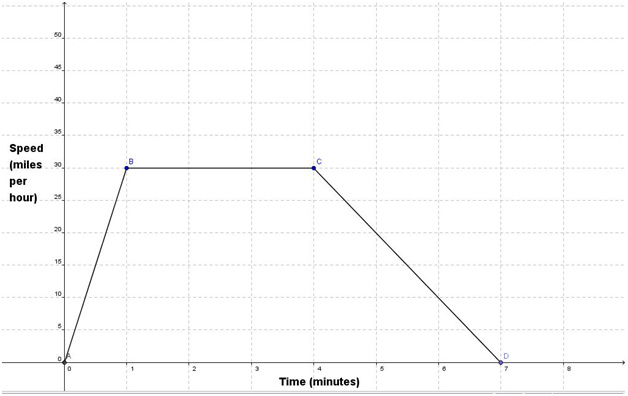
According to the graph, which of the following statements appears to be true?

A. The car’s speed increases steadily for 1 minute after it left the school.
Correct! The car’s speed increased steadily from 0 to 30 miles per hour after it left the school. This is evident by the straight line on the graph between point A and point B.
B. The car maintains a speed of 30 miles per hour for 4 minutes.
Incorrect. Look again at the point where the car reached 30 miles per hour, point B. Three minutes passed before the car began to slow down at point C.
C. The car’s speed increases steadily as it approaches the baseball game.
Incorrect. Notice the direction of the line segment between points C and D.
D. The entire trip from the school to the baseball game took 4 minutes.
Incorrect. Find the sum of segments AB, BC, and CD.
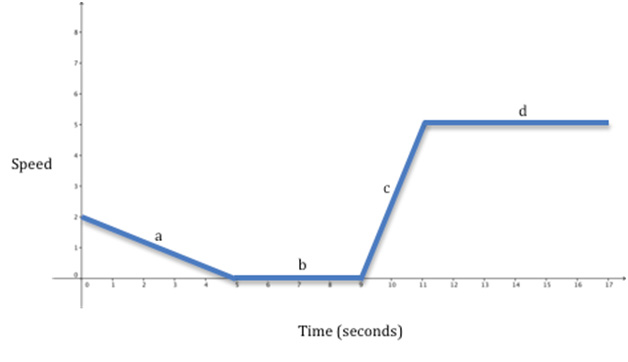
The graph represents the speed of a bicyclist (in miles per hour) as he travels to the park.

A. The bicyclist’s speed begins at 0 mph and increases to 2 mph after 5 seconds.
Incorrect. The y-intercept of line segment a represents the initial speed of the bicyclist.
B. The bicyclist maintains a speed of 5 mph for 4 seconds during line segment b.
Incorrect. Notice the y-value of the beginning of line segment b. This represents the speed of the bicyclist at that point.
C. The bicyclist’s speed decreases rapidly between 9 and 11 seconds during the trip.
Incorrect. Notice the slope of line segment c. Since this line segment is slanted up toward the right, this represents an increase in speed during this time period.
D. Between 11 and 17 seconds, the bicyclist maintains a constant speed of 5 mph.
Correct! To determine the speed of the bicyclist during this time period, consider the y-value. In addition, since line segment e is horizontal, this shows a constant speed.
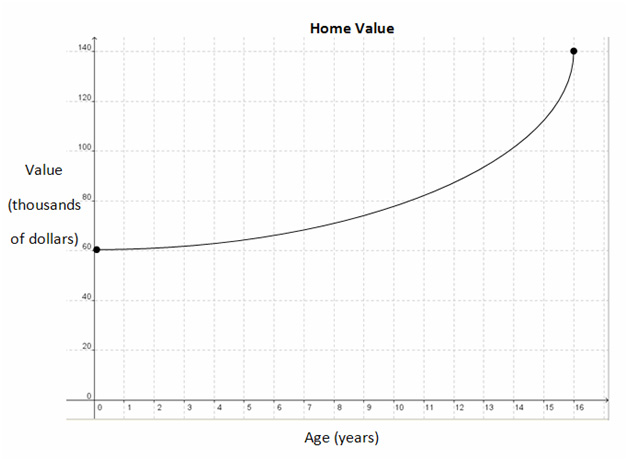
The graph below shows the relationship between the value of a home in thousands of dollars and the age of the home in years.

A. The value of the home began at $60,000 when it was new.
Incorrect.This
is a true statement.To determine the
value of the home when it was new, find the y-intercept.This is the value of the home at 0 years.
B. The value of the home increased to $140,000 after 16 years.
Incorrect. This is a true statement.To determine the value of the home when it was 16 years old, find the age of 16 on the x-axis, and find the corresponding y-value of the graph.
C. The value of the home increased by approximately $10,000 from year 0 to year 8.
Incorrect. This is a true statement. To determine the change in value, find the value of the home at year 8 and subtract the value of the home at year 0.
D. The value of the home increased more from year 0 to year 8 than from year 8 to year 16.
Correct! This is false. The value of the home increased by approximately $10,000 from year 0 to year 8. The value of the home increased by approximately $70,000 from year 8 to 16.
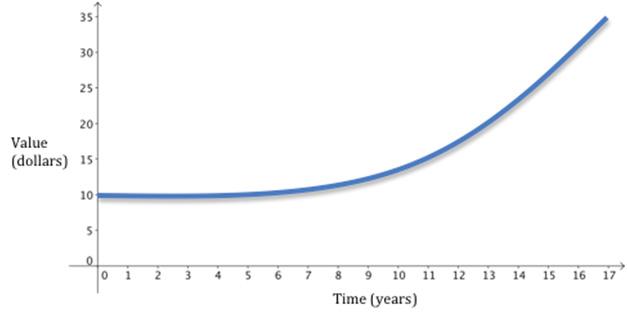
The graph below shows the relationship between the value of a trading card and the years that have passed since it was purchased.

A. The value of the trading card when it was purchased was $10.
Incorrect. This is a true statement. To determine the initial value of the card, identify the y-intercept of the graph.
B. The value of the trading card increased by $25 over the 17 years after it was purchased.
Incorrect. This is a true statement. To determine the increase in value of the trading card over the 17 years after it was purchased, find the difference between the value of the card at year 17 and the value of the card at year 0.
C. The value of the trading card 35 years after it was purchased was $17.
Correct! This is false. The x-axis represents the time that has passed since the trading card was purchased and the y-axis represents the value of the card.
D. The value of the trading card 17 years after it was purchased was $35.
Incorrect. This is a true statement. To determine the value of the trading card 17 years after it was purchased, find 17 on the x-axis and locate the corresponding y-value on the graph.