Veritcal Fraction code
1 2
Question 3:
Mrs. Murphy’s class conducted an experiment involving the distance traveled by a small car after being released at the top of a ramp. The data collected by one group of students is shown in the table below.
Distance Traveled
|
Height of Ramp, x |
Distance traveled, y |
2 |
12 |
3 |
18 |
4 |
24 |
5 |
30 |
Which equation best represents the relationship between the height of the ramp, x, and the distance traveled, y?
Question 4:
Which equation best describes the relationship between the corresponding values of x and y in the table.
x |
y |
–2 |
–9 |
0 |
–5 |
1 |
–3 |
4 |
3 |
Question 6:
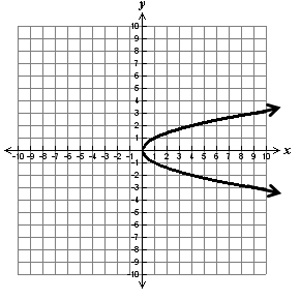
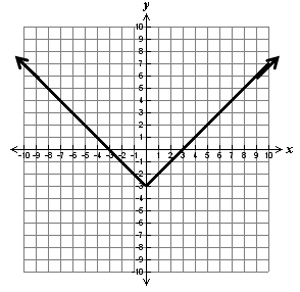
Which of the following graphs represents y as a function of x?A. |
B. |
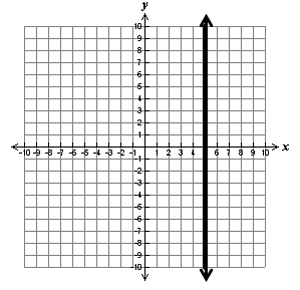
C. |
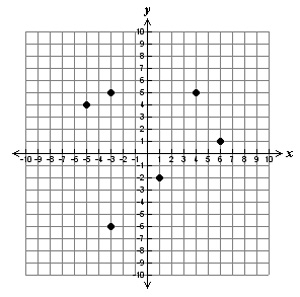
D. |
Question 7
Johanna owns a plumbing company. She charges an $85 trip charge plus $25 per hour. Johanna has determined the cost, c, per job to be
c = 85 + 25h
where h represents the number of hours it takes to complete the job. What is the best description of this function?
Question 13 (14, 19, 20 have same format, just change inequality or equations and image numbers)
Which graph best represents the inequality y > x - 4?
A. 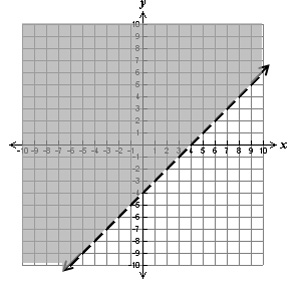 |
B. 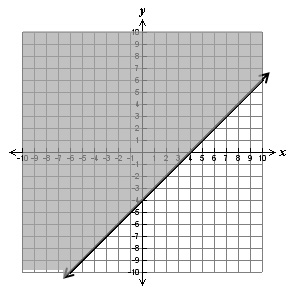 |
C. 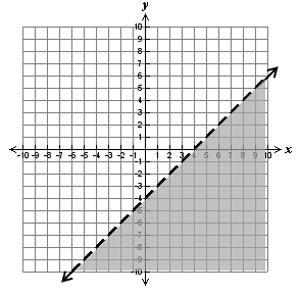 |
D. 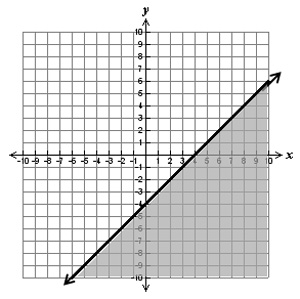 |
Question 15
The function y = 3x + 1 can be represented in several other ways. Which is NOT a correct representation of this function?A. |
B. The dependent variable, y is 1 more than 3 times the independent variable, x. |
C. 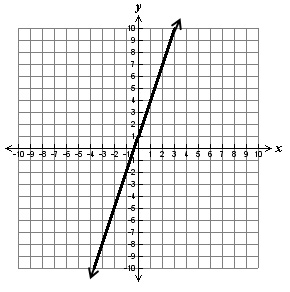 |
D. {(–5, –2), (1, 0), (4, 1), (7, 2)} |
Question 16
Which of the following best represents the function f(x) = {(–3, 9), (0, 0), (2, –6), (3, –9)}?A. 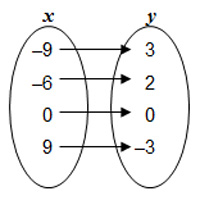 |
B. 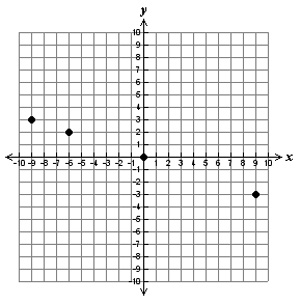 |
| C. y = –3x and the domain is {–3, 0, 2, 3} | D. x is an integer greater than –4 and y is 12 more than x |