
In this section, you will determine and interpret the center of numerical data that are represented in stem-and-leaf plots and dot plots. When you interpret the center of data, you are referring to either the mean or the median of the data set.
Practice finding the mean using Mr. Smith’s fourth period ELA class’ 10 question assessment scores.
The students’ assessment scores are as follows.
70, 60, 80, 90, 50, 100, 80, 90, 80, 70, 50, 90, 100, 90, 80, 70, 70, 80, 90, 80, 100, 100, 70, 80, 80
 Follow the steps below to find the mean of the scores. Click on the Continue button to begin the animation.
Use the information from the interactive to answer the following questions.
Interactive popup. Assistance may be required.
The mean is also the average, a value that would be near the middle of most of the numbers, a general representative of the number values.
Interactive popup. Assistance may be required.
If the mean is the center, the average or a general representation of the classes’ understanding of the material, did the students understand the material?
Success in providing students with a good education is when each demographic area of the student body is successful. Below are the national graduation rates for African Americans from 2006 to 2012. Follow the steps below to create a stem-and-leaf plot for the information.

Source: Pros and Cons of the U.S. Higher Education System
Use the stem and leaf plot to answer the following.
Interactive popup. Assistance may be required.
In order to find the mean, add the percentages together and then divide by 7, the number of percentages provided.
Click below to find the median for the information above.
Interactive popup. Assistance may be required.
The median is the number in the middle, how would you find the number in the middle?
Interactive popup. Assistance may be required.
The median is considered part of the center or middle of the data. How would you find the middle when two values are given?
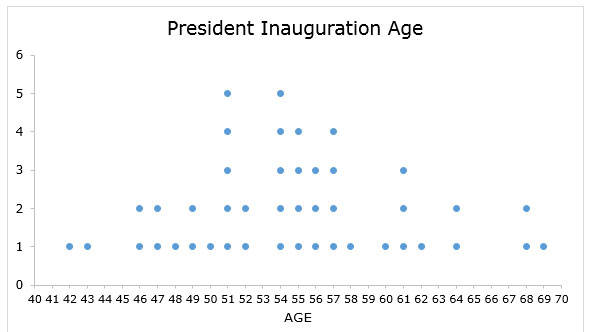
A president that is elected to a four-year term has to be at least 35 years old. Below is a dot plot showing the ages in years of the presidents on the day of their inauguration.
Interactive popup. Assistance may be required.
In order to find the mean, add the ages together and then divide by the number of presidents we have had, 44.
Interactive popup. Assistance may be required.
Since the ages are already sorted in order, look at the spread of the data points. There are a few points at each end, but notice that most of the data points are at the center of the data.
Interactive popup. Assistance may be required.
The numbers are sorted in order. Find the number that is in the middle of the group of data. Looking at the dot plot, a reasonable estimate would be 51 and 57, which is where most of the numbers are located.