In this resource, you investigated real-world applications of graphs of quadratic functions. In particular, you explored ways to interpret
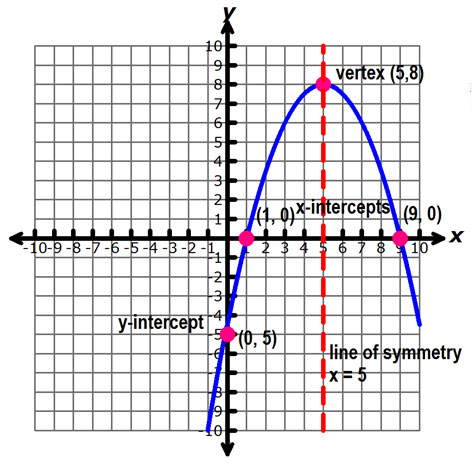
The graph below shows important attributes of the graph of a parabola that you can use to analyze and interpret the graphs of quadratic equations.
The y-intercept is the point where the parabola crosses the y-axis.
The x-intercept is the point, or points, where the parabola crosses the x-axis. There may be 0, 1, or 2 x-intercepts, depending on the parabola.
The vertex is the turning point in a parabola. If the parabola opens downward, the vertex is a maximum point, and if the parabola opens upward, the vertex is a minimum point.
The line of symmetry is a vertical line passing through the vertex. A parabola is symmetric about this line, meaning that pairs of points in the parabola are equidistant from this line.