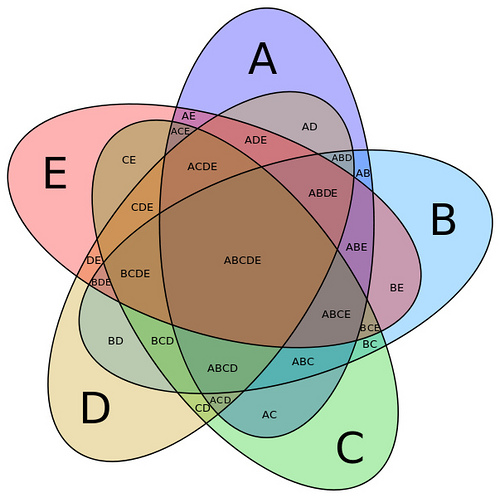
Source: Five-set Venn diagram using congruent ellipses in a radially symmetrical arrangement devised by Branko Grünbaum., Tim Bonnemann, Flickr
In this section, you will look at diagrams. Recall that a diagram is a plan, sketch, or outline designed to show how something works or to clarify relationships between the parts of a whole.
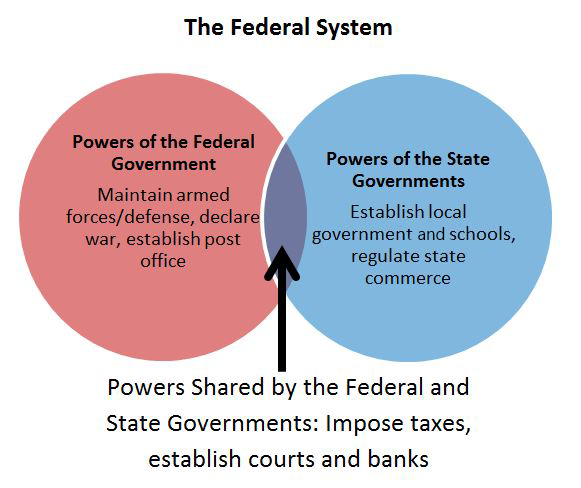
Evaluating a diagram for clarity varies with the type of diagram. Let’s look at the Venn diagram below. This type of diagram uses circles to represent sets, with the position and overlap of the circles indicating the relationship between the sets. In the one below, you can see that there is a title, “The Federal System,” and two circles that overlap, and text inside each circle. To evaluate the clarity of this type of diagram, you need to read the text within each of these shapes, keeping in mind the title of the diagram, and ask these questions:
- Does the text inside the shapes fit with the title?
- Can you make logical connections between the texts in the shapes?
- Does this information lead you to draw logical conclusions?
Source: federalsystem, IPSI
In the diagram above, the text within the shapes seems to fit the title because the words relate directly to our national system of government. Connections can also be drawn between the texts in the shapes because each shape includes clear descriptions of various powers of government according to their specific levels.
 Using the information in the Venn diagram, what logical conclusions can you draw? Use your notes to write these down. When you’re finished, check your understanding to see a possible response.
 The Federal System includes powers of government given to the states as well as to the federal government. In addition, there are some powers of government that they share.
Of course, Venn diagrams aren’t the only type of diagram you will run across in your readings. The diagram you are about to see is an interactive diagram that combines graphic and text elements with action (video). Take a look at this interactive diagram that combines graphic and text elements with action (video). Note: All the information in the interactive diagram is not real and was created as an example only.
Guiding Questions for Diagrams
- Is there a title or subtitle? How well does it describe the information in the diagram?
- Is there a legend? Is it easy to see and understand? Does it help you interpret the information?
- Is the diagram labeled? Are the labels clear and concise?
- Are there any other features (e.g., color, text, video action) that help define the information in the diagram?
Respond to the guiding questions above to help you evaluate the interactive diagram for clarity. Use your notes to write your response. When you’re finished, check your understanding to see possible responses. - There is neither a title nor a subtitle. This does not help the clarity of the diagram.
- There is a legend, and it is in a prominent place. It is color-coded which helps me understand how it relates to the other information in the diagram.
- The diagram is labeled clearly, but the text could be bigger to make it easier to read.
- Several other features in this diagram enhance its effect and meaning. The “Play” and “Step” buttons are useful and engaging. The “Step” feature makes the meaning of the diagram easier to understand because it gives a viewer the ability to stop the action so that the viewer can see the “Velocity” reading. The circle graph in the center of the diagram makes it clear how the position of the car relates to the kind of energy it produces.