In addition to Cornell Notes, graphic organizers are another effective method for arranging your ideas. Graphic organizers are also called visual maps, mind maps, and visual organizers. The information that you include in them can be identical to the information you gather when taking notes, except that the information is organized visually.
Notice the way the vegetables are arranged in the photograph below. Each type of vegetable is grouped—carrots one place, lettuces another, and so on. This picture is a visual organizer in a sense because it visually arranges the vegetables. In this section, you will learn how to visually arrange information for the topic “The Great Texas Drought of 2011.”
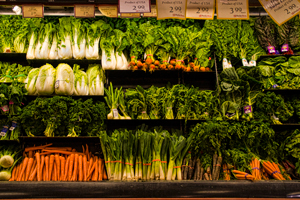
Source: Veggies, Calliope, Wikimedia
One way to organize ideas for an essay is to use grouping—also known as mind mapping and concept webbing. These terms refer to ways of relating ideas to each other. Study the example below.
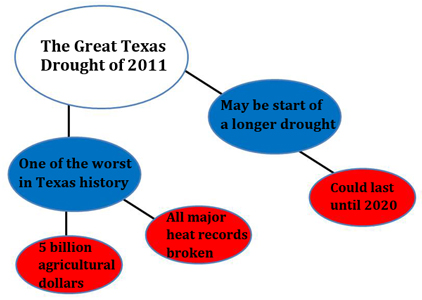
Do you see how the categories are organized? The subject, “The Great Texas Drought of 2011,” appears in the largest oval. We know this text is the subject or topic because every other oval connects to it either directly or indirectly. The main ideas appear in the blue ovals: “One of the worst in Texas history” and “May be the start of a longer drought.” These ovals connect directly to the subject. The supporting details appear in the red ovals: “5 billion agricultural dollars,” “All major heat records broken,” and “Could last until 2020.” These details connect to the two main ideas.

Source: Blowing Sand on Lakeshore, TexasEagle, Flickr
Study the relationships in the graphic organizer below. Decide whether each idea should be the subject, a main idea, or a supporting detail. When you have an answer in mind, drag and drop the idea into the correct oval.
After organizing our notes in a graphic organizer, let’s create a working outline. Did you notice that the structure of the two graphic organizers in this section created a visual outline? For example, the information from the first graphic organizer could be used to create a working, text-only outline that looks like this:
The Great Texas Drought of 2011
- One of the worst in Texas history
- All major heat records broken
- Five billion agricultural dollars lost in Texas
- May be the start of a longer drought
- Could last until 2020
You could have created the same outline using the topic, main ideas, and supporting details from your Cornell Notes page. It doesn’t matter whether you use notes or a graphic organizer to create an outline as long as the working outline helps you write the first draft of your paper. While you are writing the first draft, you may want to revise, change how ideas are arranged, or add new information. You can change your working outline in each and every instance. Who knows? Even your thesis may change!
That’s why this outline is called a “working” outline and not a “formal” or “final” outline; it can be revised over and over again. In fact, it’s important not to commit to a detailed plan that will discourage changes during the drafting process. You can develop a formal outline to serve as a checklist for logic, coherence, and unity in your paper after you finish writing the first draft.